

How to Choose Strategy Settings for a Prop Firm Challenge
Choose strategy settings by checking the complete trade path against your prop firm’s loss limits, profit target and other account rules before ranking net profit. Lower-profit settings can fit those constraints better, but the selected candidate still needs a separate test on data that did not influence the choice.
That does not make lower profit inherently safer. A weaker candidate can still fail every important check. The useful comparison is between complete trade paths under the same account rules, followed by a separate test on data that did not influence the choice.
Set the decision rule before ranking the candidates
Write down the account requirements first. Separate an account-ending breach from a condition that delays completion. Then identify the evidence needed to evaluate each requirement, including anything missing from the available trade export.
For a research comparison, you might reject any candidate that breaches the correctly modelled floor, then compare target completion among the survivors. A separate daily concentration check might delay a candidate rather than eliminate it. That ordering should reflect the actual account wording, not whichever scoring method makes the favourite result look strongest.
Keep ordinary performance questions alongside the rules. How much profit remains after costs? Is a large share attributable to one exceptional event? Does the candidate operate frequently enough to generate new evidence? These questions help choose further research, but none substitutes for the account’s mandatory conditions.
Use the prop firm rules and metrics guide to build the mapping. Treat the selected constraints as fixed inputs for the comparison rather than extra optimization knobs.
Three fictional candidates, three different conclusions
Consider a constructed research screen with a $3,000 profit objective, a $2,000 maximum drawdown allowance and a best-day share no greater than 40% of total net profit. These thresholds are invented for the example and do not describe a named firm’s product.
Assume all candidates use the same instrument, quantity, dates and costs. The drawdown figures below are illustrative observed peak-to-trough figures from a hypothetical model, not a claim that every firm uses that formula. Other account requirements are deliberately outside this small screen.
| Candidate | Net profit | Modelled drawdown | Best day | Best-day share |
|---|---|---|---|---|
| A | $6,000 | $2,400 | $2,700 | 45% |
| B | $4,200 | $1,300 | $1,260 | 30% |
| C | $2,800 | $800 | $700 | 25% |
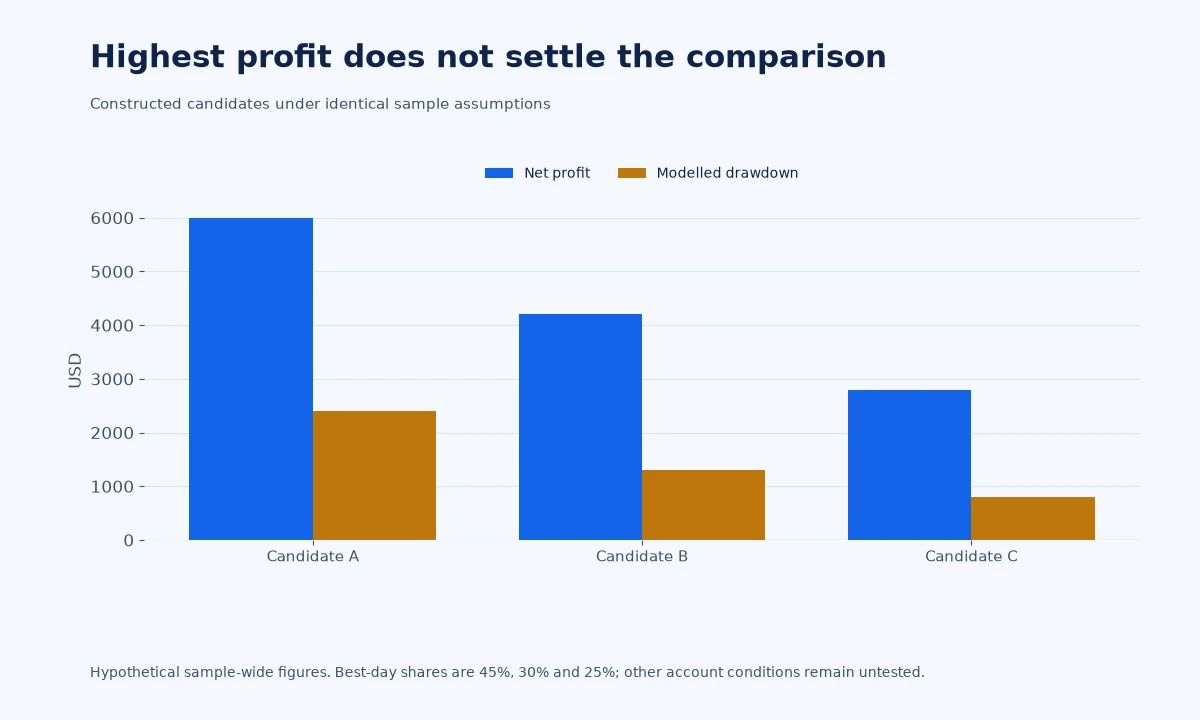
A has the greatest profit but exceeds both the invented drawdown allowance and concentration threshold. B meets those three numerical conditions over the illustrated sample. C has smaller drawdown and less concentration, yet remains $200 below the profit objective. Ranking only profit would favour A; ranking only drawdown would favour C.
B is therefore the candidate worth investigating next under this limited screen. It has not been shown to pass a real evaluation. We have not established intratrade equity, minimum days, prohibited-event compliance or whether the conditions were satisfied together at an eligible completion time.
The distinction matters when describing the result to another trader. Write “met the three modelled sample-wide conditions,” rather than “proven challenge winner.” A precise description preserves what the evidence actually supports.
Do not confuse less trading with a better system
A filter that removes half the entries may reduce drawdown simply because the strategy is exposed less often. It may also remove enough profitable opportunities that the target takes substantially longer. Compare exposure and opportunity count before attributing the improvement to a better signal.
For example, an entry filter might retain only quiet sessions. That can make historical losses look smaller while leaving the candidate almost untested during fast markets. Label that narrower scope. Do not present the filtered result as evidence for conditions the strategy now avoids.
Position size creates another comparison trap. If A uses twice B’s contracts, the table is partly comparing exposure. First run a consistent-size comparison, then evaluate any sizing policy as its own design choice. A lower nominal profit can otherwise be mistaken for improved entry logic.
Use the position-sizing guide when translating the selected candidate back to the intended account. Changes in size should trigger another rule-path review, not just multiplication of the final profit.
Watch the denominator and the clock
A consistency share can improve when the sample gets longer, even if the strategy’s daily behaviour has not changed. In our example, B’s $1,260 best day is 30% of $4,200. Against only $2,100 of accumulated net profit, the same day would represent 60%.
That is why a whole-history percentage should not be silently treated as the percentage at challenge completion. Calculate the actual denominator required by the product and inspect the relevant window. The consistency-rule explanation provides background on the distinction.
Target timing matters in the same way. Record when the target and all other completion conditions were first satisfied together. A candidate can touch the target, lose part of it and finish the sample above it again. Those are different events; a single ending balance cannot tell you which one matters.
If your model lacks the needed event timing, mark the conclusion incomplete. An explicit missing-data note is more useful than a confident ranking built from incompatible measurements.
Protect the next test from the selection process
Write down why B was selected before inspecting a held-back period. Preserve A and C in the record, along with every other trial. The apparent winner was chosen from a search, and reviewers need to know the size and freedom of that search.
Freeze parameters, sizing and cost assumptions for the next test. Decide in advance which outcomes would cause rejection or further investigation. If B disappoints, record that result before changing anything. Repeatedly improving the design against the same held-back prices turns them into development material.
Tradelyze’s validation guide explains the separation between tuning and unseen-data review. Apply that separation to the rules you used for selection as well as to the strategy’s entry parameters.
A useful handoff includes the original rule sheet, all candidate rows, the selection reason and unresolved evidence. It should let another person understand why the higher-profit candidate was rejected without trusting a composite score or a marketing label.
Questions about optimizing for a challenge
Should I always select the lowest-drawdown settings?
No. Check whether they still offer enough opportunity to meet the objective and whether the smaller loss reflects reduced exposure. The right next research candidate must be assessed against all relevant constraints, not one attractive metric.
Can I loosen a rule until the strongest candidate passes?
Only change a rule to correct an error or reflect verified account terms. Changing a threshold for convenience changes the question you are testing. It does not change what the firm requires.
Does this comparison describe a Tradelyze optimization feature?
It describes an editorial analysis method. Check the current custom-rule documentation for the scope of product checks. The constructed ranking is not a screenshot, measured app output or a guarantee of future suitability.
Methodology: All candidates, thresholds and results are hypothetical. Documentation was reviewed on 16 November 2026. No live account outcome is claimed.