

Position Sizing for Prop Firm Challenges Using Your Loss Buffer
A $50,000 evaluation can have only $800 left between the current account value and its loss floor. A 1% calculation on the account label gives $500. That would use more than half of the remaining room in a single trade, even before fees. Position sizing for prop firms starts with the dollars the account can still lose and the dollars one contract could lose at the planned exit.
The worksheet below follows a hypothetical Nasdaq futures trade from the account dashboard to a whole-contract count. The figures are illustrative. Substitute the limits for your own program and the costs for the actual contract.
Find the remaining loss buffer
Read the current account value and the active loss floor at the same time. Use the measure the firm monitors, which may include open profit and loss. Subtract the floor from that value. Then check whether a daily limit leaves less room. For a flat account, those steps give you two figures you can compare directly.
Suppose the monitored value is $50,350 and the current floor is $49,550. The gap is $800. The example account also has $300 left before its session loss threshold. Losing $350 would leave the account above its overall floor but cross the session threshold. If the program has no daily limit, leave that field blank.
How the floor moves matters. For instance, Topstep describes a Trading Combine maximum loss limit that can rise with the end-of-day balance while being enforced during the session, including unrealized P&L. Check both the update time and the breach condition for the program you use. Topstep’s Maximum Loss Limit rules.
Set a dollar budget for this entry
The gap to the closest threshold is the outer boundary. Decide how much of that room the trade plan allocates to this entry and how much stays available for execution uncertainty, other positions and later trades.
| Worksheet entry | Illustrative amount |
|---|---|
| Room above the overall floor | $800 |
| Remaining room under the daily rule | $300 |
| Planned budget for this entry | $100 |
| Daily room left if the entry loses exactly its budget | $200 |
The $100 is an assumption for this example. If another position is open, estimate its additional exposure from its current marked price to its planned exit. A loss already reflected in the dashboard has already reduced the buffer. Deducting that past loss again would count it twice. Also check working entries that could fill while the new order is active.
Convert the stop distance into dollars per contract
Suppose the planned entry and stop are 20 Nasdaq-100 index points apart. CME gives MNQ a $2 multiplier per point and NQ a $20 multiplier. Both have quarter-point ticks, so the distance is 80 ticks. See CME’s Micro E-mini Nasdaq-100 specifications and E-mini Nasdaq-100 specifications.
| At a 20-point stop | One MNQ | One NQ |
|---|---|---|
| Dollar value per tick | $0.50 | $5.00 |
| Price exposure before costs | $40 | $400 |
| Assumed round-trip fees per contract | $2 | $5 |
| Assumed adverse execution of one point per contract | $2 | $20 |
| Modeled loss per contract | $44 | $425 |
Fees in the table are invented for the worksheet. Replace them with the all-in charge for both sides of your trade. The one-point execution allowance is also an assumption. A stop can execute farther away in a fast market. A stop-limit order can remain unfilled.
Ten MNQ and one NQ each have $400 of price exposure over 20 points. With the specific cost assumptions above, ten micros model at $440 and one mini at $425. Compare the same underlying exposure when checking fees. Comparing one micro with one mini answers a different question.
How many contracts fit the budget?
Divide the entry budget by the modeled loss per contract and round down. Then apply the program’s remaining contract allowance, including any rule about how micros count toward that cap.
With a $100 budget, two MNQ model at $88 and leave $12 of the entry budget unused. Three would model at $132 and exceed it. One NQ would model at $425, so zero NQ fit. The $12 is a margin within the plan. Execution can still exceed it.
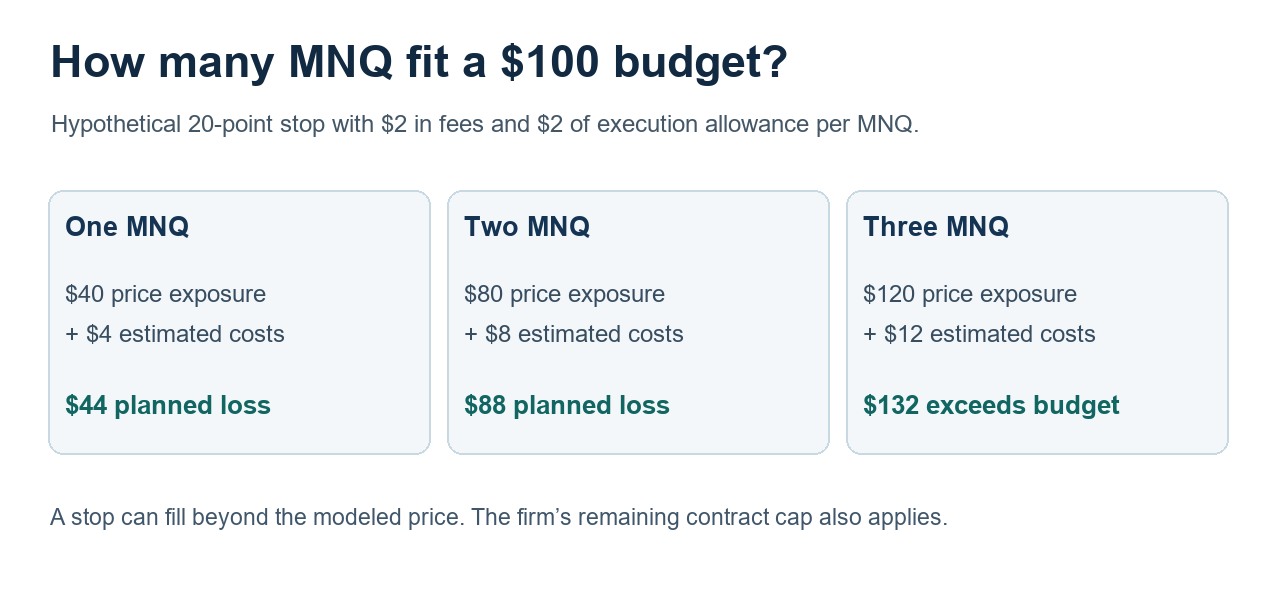
Now change one input. If a prior trade reduces the remaining daily room to $65, a $100 budget is no longer available. Even before reserving additional room, two MNQ at $88 exceed $65. If the revised entry budget is $35, even one MNQ at $44 exceeds it. Record zero for that setup. Rounding up or tightening the stop solely to make the contract fit changes the trade you tested.
Check the count against the strategy’s loss history
The stop worksheet describes one entry. A challenge spans a sequence of trades. Repeated small losses can exhaust a daily allowance even when each entry fits on its own.
For example, assume a separate one-MNQ backtest produced a $165 worst day and a $460 stressed drawdown. A rough two-contract scale gives $330 and $920. Both exceed the illustrative $300 daily room and $800 overall room. The single-entry worksheet allowed two, but the historical stress comparison gives a reason to test a smaller size. Re-run with the intended quantity, commissions and slippage. A historical loss figure cannot bound the next one.
Tradelyze’s Learn guide explains how to compare a one-contract worst day with a daily limit and a Monte Carlo drawdown with a total allowance. Use that method when reviewing the strategy across a challenge. For an order you are considering today, refresh the account figures first. Tradelyze position-sizing methodology.
Keep a sizing record you can reproduce
Save the account stage, rule source, dashboard timestamp, current floor, remaining daily room and entry budget. On the same line, record the contract, entry, stop, point value, round-trip fees, execution allowance and contract cap. After the trade, compare the actual execution and fees with the assumptions. That difference is useful the next time you size the same setup.
Refresh the worksheet whenever the floor, open positions or remaining daily room changes. To see how a different drawdown rule can change the same strategy’s result, read Tradelyze’s guide to prop firm backtesting rules and metrics.




3 Comments