
How to Backtest an Opening Range Breakout Strategy on MNQ
An opening range breakout (ORB) starts with the high and low of the first few minutes of a session. To backtest it on Micro E-mini Nasdaq-100 futures (MNQ), freeze those levels when the window ends, define what price must do to trigger an entry, and simulate the earliest fill your rules allow. For a prop firm challenge, replay those trades in order with costs and the account’s loss limits.
Start with one reproducible version of the opening range breakout. Keep its settings fixed while checking the mechanics. Changing the range length, entry style and stop together can produce a better-looking report without revealing which decision caused the difference.
The workflow below is a test design, not a recommended trading setup. Its numbers are constructed examples, and none represents a tested or profitable MNQ system.
How to define the opening range on MNQ
“Buy the opening range breakout” leaves important decisions unresolved. Does a price touch count, or must a candle close above the range? Does the order enter immediately, on the next bar or on a later retest? Can the system trade both directions in one session?
Use a specification that another person could implement without asking what you meant. For example, a research version might measure the high and low from 09:30 through 09:44:59 in America/New_York, freeze that range at 09:45 and consider entries afterward. These are illustrative design choices. They are not evidence that a 15-minute range performs best.
| Decision | Record before testing |
|---|---|
| Opening range | Start, end, timezone and treatment of missing bars |
| Entry | Price touch or confirmed close; order type; earliest eligible fill |
| Risk | Stop location, contract quantity and permitted simultaneous positions |
| Exit | Target, stop, session close and cancellation of unfilled orders |
| Repeat attempts | Maximum entries and whether direction can reverse |
Timezone settings deserve their own check. TradingView documents how Pine sessions and timezones interact. Inspect a winter date and a summer date on the chart instead of assuming a fixed UTC offset always represents the intended New York session.
What counts as a breakout: a wick, a close or a retest?
Suppose the first 15 minutes after the U.S. stock market opens produce an MNQ high of 20,010 and a low of 19,990. At 09:47 New York time, price trades up to 20,011 and the one-minute candle closes at 20,009. A buy stop placed one tick above the range after 09:45 could trigger at 20,010.25. The actual fill depends on price and liquidity. A rule that requires a close above 20,010 still has no signal.
Now suppose the next candle closes at 20,014. A close-confirmed rule can generate its signal then. Under TradingView’s default strategy settings, a market order normally first fills on the next available tick, usually the next bar’s open in a historical test. A retest rule would still wait. One testable definition is a later candle that touches 20,010 and closes back above it. Record how many breakouts never return to the level.
For a reproducible baseline, try one contract, the first confirmed one-minute close outside the frozen range in either direction before 11:00 a.m. New York time, and at most one entry per day. Model a stop 30 points from the fill and a target 60 points away. Close any surviving position at a specified time before the applicable session cutoff. These are example settings to test. Repeat the same baseline with a five-minute opening window while keeping the one-minute signal bars and exits fixed.
How much does a 30-point MNQ stop cost?
CME specifies MNQ at $2 per index point, with a minimum movement of 0.25 points. One tick therefore represents $0.50 per contract. These contract values come from CME’s MNQ specifications; the costs and stop distance below are hypothetical.
Suppose the intended stop is 30 points from the entry. That is $60 of price risk for one MNQ contract. Add an assumed $2 round-trip fee and an allowance of two adverse ticks at entry plus two at exit. Those four ticks add $2 per contract, producing an illustrative planned loss of $64.
| MNQ contracts | Price risk | Assumed fees and slippage | Illustrative planned loss |
|---|---|---|---|
| 1 | $60 | $4 | $64 |
| 2 | $120 | $8 | $128 |
| 3 | $180 | $12 | $192 |
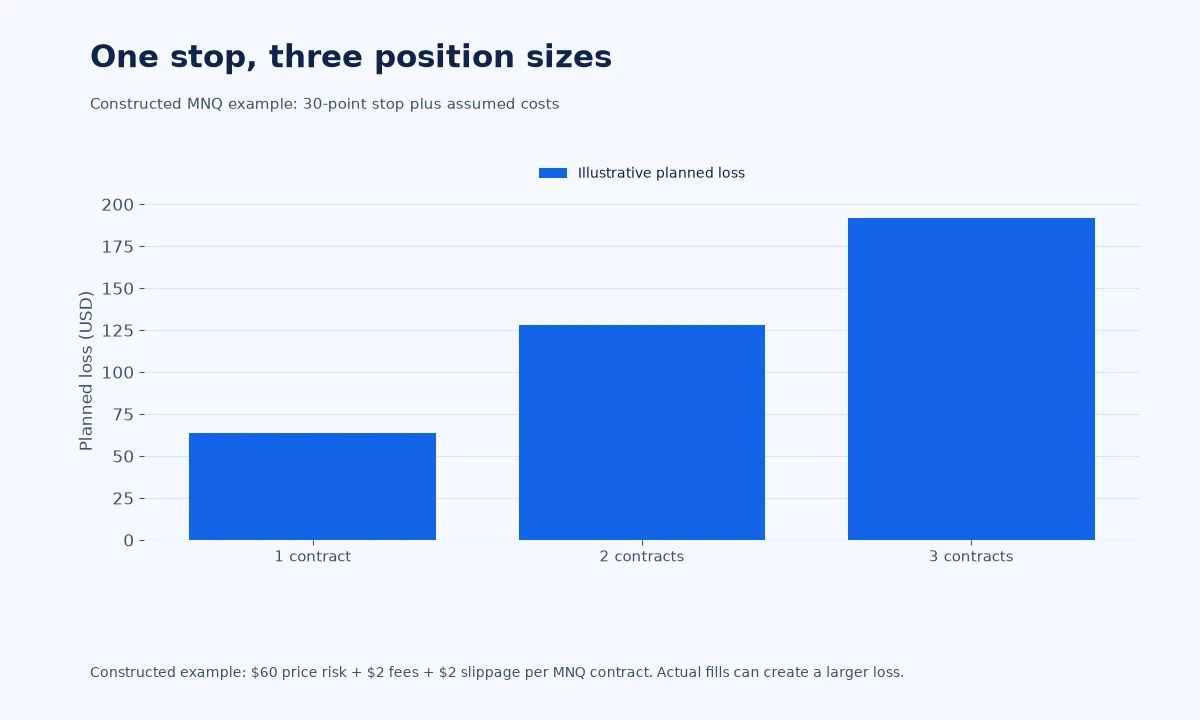
If the account has $600 remaining above its applicable floor, three such planned losses at three contracts consume $576. That arithmetic leaves just $24, before any loss beyond the assumed fill allowance. It does not establish that three contracts are suitable, or that a stop caps the actual loss at $192.
The advertised account balance is not the amount you can lose. Work from the remaining floor distance and the strategy’s stop geometry. The guide to position sizing for prop firm challenges develops that distinction.
Audit several trades before optimizing anything
Choose examples with different outcomes: a clean breakout, a false breakout and a day where an entry and exit level lie inside the same candle. Record when the range became known, when the signal became valid and when the order could first exist.
A common logical error is using the completed opening range to enter before that range has finished. Another is recording a fill at the breakout price even though the strategy waits for a candle close that occurs beyond it. In both cases, attractive arithmetic can conceal an impossible sequence.
TradingView’s strategy documentation explains that historical fills use a broker emulator with assumptions about movement inside bars. Treat candles containing competing order levels as audit cases. More detailed data can help investigate them, but a simulated fill still does not establish the live fill you would receive.
Keep a short reconciliation sheet with expected and simulated entry times, prices, size and exit reason. If they disagree, resolve the cause before searching for stronger settings. Optimization is wasted effort when the baseline implements a different idea from the one you intended.
How to run the ORB backtest in TradingView
Open a standard candlestick MNQ chart and add a Pine strategy that implements the entry and exit rules. An indicator that only draws the opening range can help you check the levels visually. To get simulated trades in Strategy Tester, the script must submit strategy orders. Record the symbol, date range, chart interval and contract roll settings so you can repeat the run.
In the strategy properties, enter the starting capital for the challenge you are modeling, contract quantity, commission and slippage. If your one-contract example uses a $2 round-trip commission, a per-contract cash commission of $1 per side models that assumption. A slippage setting of two ticks applies to each eligible market or stop fill. Check the order types in your trade list before applying the four-tick round-trip estimate to every exit.
Inspect a day when the stop and target both lie inside one candle. If available, use Bar Magnifier to examine the fills with lower-timeframe bars. If the sequence is still unknown, flag the trade and compare the stop-first and target-first outcomes. Document sensitivity to that choice. See the TradingView strategy and broker emulator documentation.
Evaluate the path under the account rules
Once the trades make sense, attach a dated rule sheet for the exact product and stage. Include the target, floor movement, daily reset, consistency formula and any restrictions relevant to the opening session. Leave uncertain items marked unresolved rather than silently applying a generic preset.
For each session, record the smallest observed distance to the loss floor. Separate closed-trade balance from open equity. A breakout can move against the entry, threaten a limit and recover before the eventual exit; the final trade result cannot describe every point along that path.
Tradelyze’s custom-rule documentation describes checks built from closed trades. Treat missing intratrade evidence as an unresolved part of the review. Do not describe a report badge as certification of every firm term.
Then examine the target within an evaluation-sized window. A strategy that earns the required amount over a year has not thereby shown that it can reach it within your chosen challenge window. Record survival without completion separately from successful completion.
Could a profitable ORB still be too slow for a prop firm challenge?
A trader raised this exact issue after allowing for commissions and slippage in an MNQ backtest. You can answer it for your own trade list by starting a fresh simulated evaluation on several historical dates. Reset the balance and rule thresholds at each start. Play the trades forward until the first rule breach, the eligible target date, or the end of your chosen test window. Read the trader’s question on Reddit.
Keep three counts: target reached with all modeled requirements satisfied, breached before completion, and still open at the cutoff. Report the number of starts behind each count and the median trading days to completion among the completed attempts. If the firm has no time limit, label your cutoff as a research choice. Overlapping windows reuse trades, so their completion rate describes this sample and should not be read as an individual trader’s pass probability.
Alongside win rate, record net expectancy (total P&L after costs divided by trade count), the worst losing streak, and the smallest distance to a loss limit. Calculate these once for the development period and again for the untouched test period. For rules that include floating losses, check intratrade equity at the firm’s reset time. See how daily loss limits reset.
How to validate an ORB strategy on unseen data
Keep a development log containing every tested range length, entry condition and exit variant. Otherwise, the final candidate can look like a single good idea when it was actually selected from many attempts.
Choose the candidate and the review criteria before opening the held-back period. Use the same cost assumptions and account rules. Record disappointing results without changing the historical record. If you revise the design after seeing them, label that period as development data for the next version.
Finish with a permitted demo observation period. Compare the expected signal time with the observed order and fill, then explain every difference. Tradelyze’s broader strategy validation workflow is a useful companion to this ORB-specific test sheet.
Questions about testing an MNQ ORB
Is a 5-minute or 15-minute opening range better on MNQ?
For a 09:30 New York start, the five-minute range freezes at 09:35 and the 15-minute range at 09:45. Compare both on the same dates with the same execution bars, fees, slippage and position size. Count trade frequency, net expectancy and challenge breaches for each. Choose your decision rule before checking the held-back dates.
Does a smaller MNQ position make the strategy challenge-ready?
No. Smaller size changes dollar exposure, but it does not fix invalid entries, missing costs or unmodelled account rules. It may also make the profit target take longer to reach. Review both the loss path and completion conditions.
Can I use the chart’s final profit as the result?
Use it as one result alongside the first breach, smallest floor distance, cost assumptions and target date. A positive endpoint does not repair an earlier breach. Preserve the trade list so another reviewer can reproduce the conclusion.
Methodology: The sizing illustration is constructed, with hypothetical costs and stop distance. Documentation was reviewed on 13 November 2026. This article proposes an analysis workflow, not a live trading control or pass guarantee.