
How to Include Commission and Slippage in a Backtest
Include commission on both entry and exit, match the fee units to the number of contracts or orders, and test several explicit slippage assumptions. Then recalculate the trade path after costs. A strategy can show a positive gross result while leaving too little room to reach a prop firm target or stay above its loss floor.
The useful comparison is not simply “with fees” against “without fees.” Write down which costs are included, how they are charged and which assumptions remain uncertain. Then evaluate the same strategy across a predeclared range of plausible conditions.
The example below holds the trades fixed to make the arithmetic visible. It is a constructed sensitivity exercise, not measured performance or a quoted fee schedule.
Start with contracts and sides, not a vague trade count
A round trip includes an entry and an exit. A result labelled “100 trades” might mean 100 completed positions, 100 fills or 100 entry orders. Those counts are not interchangeable when calculating fees, particularly with partial exits and several contracts.
Create a small order ledger. For each fill, record instrument, quantity, side, price and the fee components included in the account schedule. If a two-contract position exits one contract at a time, the total contracts charged may be the same as a single exit, while a separate per-order charge could differ.
TradingView’s strategy properties documentation distinguishes per-contract, per-order and percentage commission modes. It applies commission on entries and exits. Match the mode and units to the fee schedule instead of entering a round-trip figure into a per-side field.
Reconcile one sample position manually before accepting the whole report. A small unit mistake repeated across hundreds of orders can be larger than the apparent edge. Record whether exchange, clearing and broker charges are already bundled so they are not added twice.
A cost table that changes the decision
Consider 100 completed round trips, each for two MNQ contracts. Assume the original simulated entry and exit prices produce $1,800 gross profit. For this example only, use an all-in trading fee of $1 per contract per side. Fees are therefore 100 × 2 contracts × 2 sides × $1 = $400.
CME’s MNQ contract specifications imply $0.50 per tick per contract. One extra adverse tick on every entry and every exit would cost 100 × 2 × 2 × $0.50 = $200 across this fixed ledger.
| Extra adverse ticks per side | Fees | Additional slippage cost | Net profit |
|---|---|---|---|
| 0 | $400 | $0 | $1,400 |
| 1 | $400 | $200 | $1,200 |
| 2 | $400 | $400 | $1,000 |
| 4 | $400 | $800 | $600 |
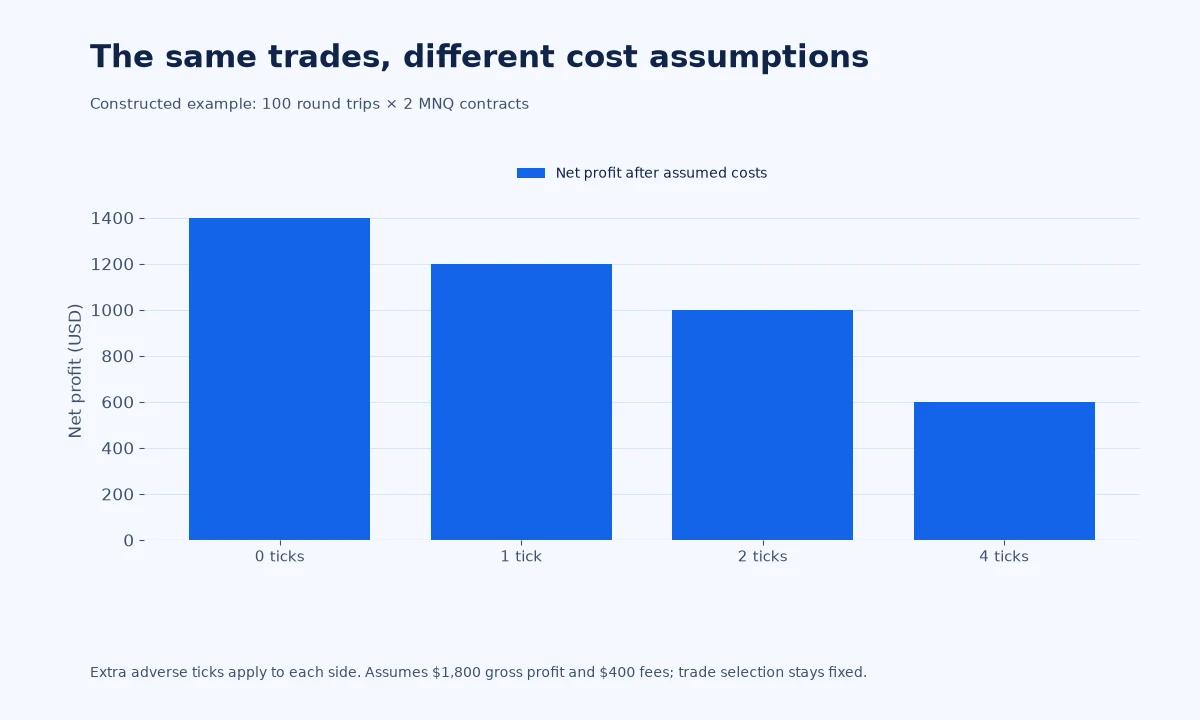
The assumptions change the remaining profit from $1,400 to $600. If an illustrative target were $1,100, the first two rows would exceed it at the end of the sample and the last two would not. Even the higher rows would still need a separate rule-path review before being called successful evaluations.
Gross average profit is $18 per round trip. After fees and four adverse ticks per side, that becomes $6. An additional $6 per round trip would remove the remaining net profit under this fixed-trade calculation. This break-even estimate describes sensitivity; it is not a prediction of future execution costs.
Slippage is a price difference with a defined reference
Specify the price against which you measure slippage. It could be the expected trigger price, the quote when an order was submitted or the simulated fill. Those references answer different questions. A comparison is useful only if the same definition is applied consistently.
The arithmetic above assumes every entry and exit suffers the same adverse adjustment. Real observations need not be uniform, and some fills can be more favourable. Collect signed differences so the dataset preserves both, then inspect unusually poor fills separately rather than allowing averages to hide them.
TradingView’s property called slippage is expressed in ticks for market and stop orders. It does not turn every limit-order assumption into a realistic queue simulation. Review order types before interpreting one setting as a complete execution model. The linked properties documentation explains the distinction.
For your own sensitivity test, specify a base scenario and more demanding scenarios before reading the final results. The examples of one, two and four ticks here are mathematical inputs, not recommended values for MNQ. Choose assumptions using your intended workflow’s evidence and label unknowns honestly.
Recalculate the path, not just the total
Subtract costs at the points where they apply. Deducting a single amount from the final profit can conceal the effect of early costs on available loss room. For a trailing account, changing the intermediate path may also change the high from which a later floor is calculated.
Build daily net results from the revised ledger, then repeat each applicable account calculation. A best day may remain large while the total net profit shrinks, raising its share of the denominator. A day close to a minimum qualifying profit threshold may no longer qualify after the correct fees.
Use the rule-to-metric checklist to decide which outputs to recalculate. Review the firm’s definition rather than assuming every account treats costs, daily boundaries or open positions identically.
If size is the reason costs and losses have become uncomfortable, return to the position-sizing calculation. Do not erase fees to make an oversized candidate look feasible.
Know when a spreadsheet adjustment is insufficient
Our table preserves the original 100 trades. That is useful for explaining cost pressure, but it cannot represent every consequence of different fills. An entry that arrives later can miss the trade entirely. A changed price can alter the stop distance, position quantity or whether another order triggers.
When a strategy’s later decisions depend on those events, rerun the execution logic with the revised assumptions. Keep the arithmetic sensitivity table as a diagnostic, and label the rerun as a separate experiment. Do not silently combine totals from different trade populations.
Tradelyze’s strategy validation guide provides the wider review sequence. Carry your cost assumptions into unseen-data and forward observations. A candidate that needs exceptionally favourable costs deserves further investigation before you commit to an evaluation.
Keep evaluation subscriptions, platform subscriptions and reset purchases in a separate operating budget. They affect your overall spending, but they are not automatically deductions inside the firm’s trading balance. Combine them only when presenting a clearly labelled total personal budget.
Cost questions worth resolving before an evaluation
Should I subtract commission from exported net profit again?
Only if that exported value excludes the relevant charge. Inspect the report definitions and reconcile a sample trade. “Net” is a label to verify, not permission to assume either that all costs are included or that none are.
What slippage number should every MNQ test use?
There is no universal number supplied by this article. Instrument, order type and timing can change the observed difference. Declare your assumptions, record their evidence and compare several scenarios without selecting only the one that preserves profit.
Does a positive result after costs establish a pass?
No. You must still inspect the loss path, target timing and remaining conditions. The custom-rule guide explains why checked historical rules and complete account compliance are different claims.
Methodology: The ledger and fees are hypothetical. The sensitivity table assumes unchanged trades and quantity. Documentation was reviewed on 16 November 2026; verify current account costs before use.